
Mining Project Operating & Capital Cost Curves
The following US$ cost curves from the 3rd edition of the Mining Valuation Handbook are based on some 95 mining development projects located in 33 countries around the world (more detailed cost curves were provided in the 4th edition). Cost curves for mining projects do exhibit economies of scale or “power” curves, which when plotted on log-log charts present themselves as straight lines as shown in the charts below. There is considerable noise or scatter as all mining projects are different even within one type of commodity, using the same mining method and metallurgical process. Readers should therefore be mindful when using these charts, as they provide only a rough guide for new mining projects. The line of best fit can be considered the “average” value for a given production rate, although there can be quite a large variation around the mean (the equation for the line of best fit is provided below each figure). The projects include base metal, precious metals, coal, uranium and iron ore.
Total Capital Costs
Capital costs are shown in two charts, one for open cut operations and the other for underground. The open cut chart is based on total tonnes mined per annum, that is total ore plus waste. As the production volumes increase the capital costs increase but at a declining rate. A project cost can vary for a given throughput due to factors such as the amount of metal refining on site; this has been limited to primarily gold and SXEW for copper. For major base metal projects no smelting and refinery costs are included. Other factors that can influence the cost include local infrastructure such as labour costs, transportation, availability of power, and complexity and hardness of the ore. For underground mines costs are also affected by the mining method employed and the general ground conditions.

US$(million) = 23.50 x T 0.688 where T = mtpa
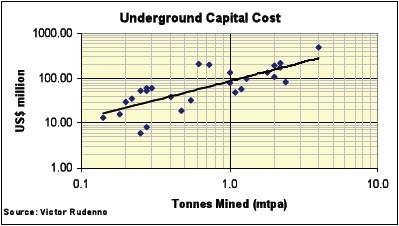
US$(million) = 86.76 x T 0.851 where T = mtpa
Treatment Plant Capital Costs
Nearly all of the mines in this study have some level of onsite processing. As mentioned above most of the mills produce a concentrate for base metals or gold bullion onsite. Plant costs for a given throughput will also vary depending on the process involved, hardness of ore and energy costs. The plant costs can be subtracted from the total capital costs to get an estimate of other capital costs.

US$(million) = 37.61 x T 0.543 where T = mtpa
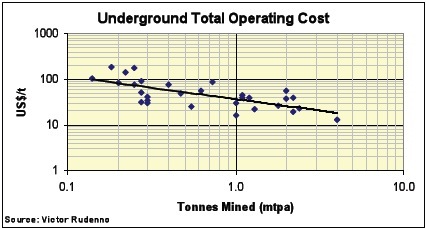
Total Operating Costs
Total operating costs are again shown in two charts one for open cut and another for underground operations. As with total capital costs the open cut chart is based on total tonnes mined per annum, that is total ore plus waste. Operating costs for a given size of operation will also vary for the same reasons as capital costs as outlined above. Additionally, consider an open cut mine with combined ore and waste production of 10 million tonnes per annum (mtpa). This could be made up of either the processing of 1 mtpa of ore and 9 mtpa of waste or 4 mtpa of ore and 6 mtpa of waste. As the cost to mine waste is less than the mining and treatment costs for the ore, the cost per tonne are likely to be higher for the latter case, if all other factors are equal. Variation in underground operating costs will also be influenced by the type of mining method employed and the factors such as shaft haulage versus declines.

US$(million) = 9.12 x T -0.4 where T = mtpa

US$(million) = 36.87 x T -0.497 where T = mtpa
Mill Treatment Cost
Treatment costs will vary depending on the type of ore and the complexity of the onsite process. Low costs are generally associated with heap leach operations while the high cost operations, for a given tonnage, are those cases where metal is produced on site, particularly SXEW. Again mill treatment costs can be subtracted from the total operating costs to get an estimate of other mining costs.
US$(million) = 10.85 x T -0.455 where T = mtpa